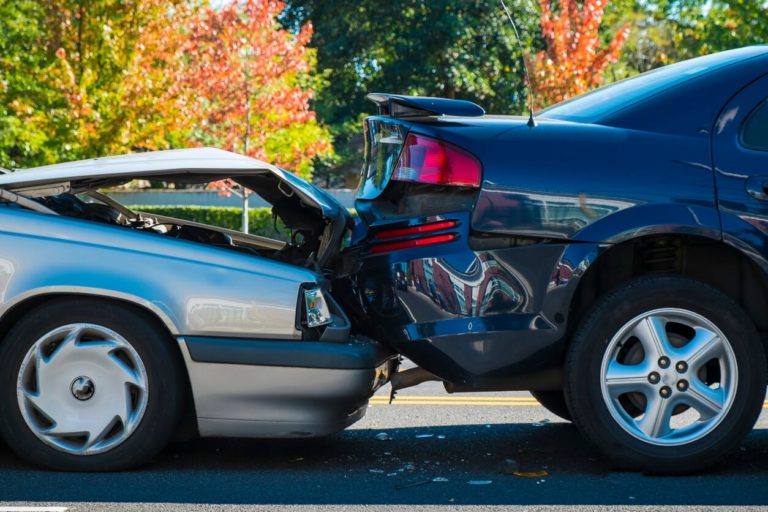
California has a rich history as a hub for motorcycling — it boasts the highest number of motorcyclists of any state, with over 900,000 registered bikes. However, this popularity comes with a stark reality: California consistently ranks among the states with the highest number of motorcycle-related deaths, with nearly 10% of all U.S. motorcyclist fatalities.
Our experienced motorcycle accident lawyers at Cohen & Marzban delve into the latest California motorcycle accident statistics, shedding light on the realities riders confront.
California Motorcycle Accidents Overview
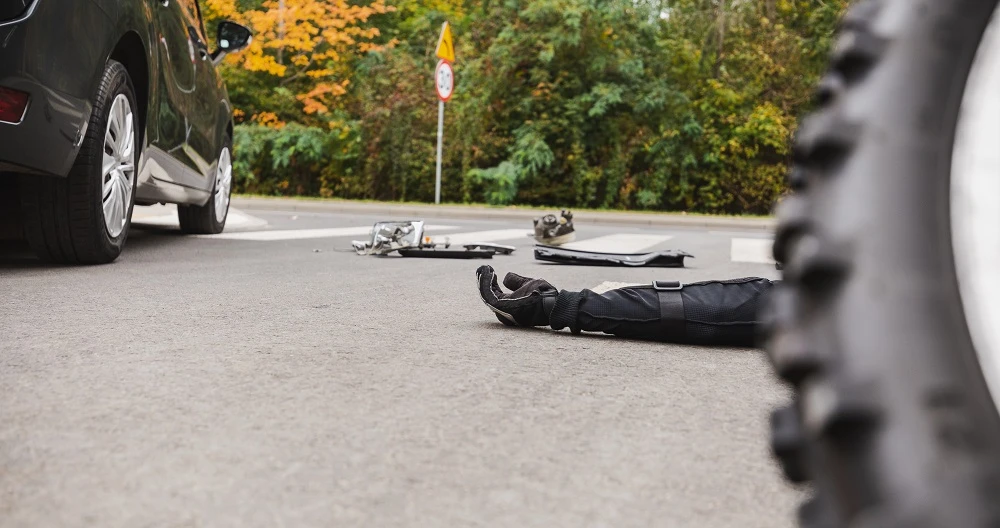
Motorcycle accidents in Los Angeles, California, are a serious concern for the city. The sobering statistics reveal a significant number of fatal accidents involving motorcycles.
While detailed information for California is not available, the National Highway Traffic Safety Administration (NHTSA) reports that 5,932 motorcycle riders were killed nationwide in 2021. This was an increase of 8% from 5,506 in 2020.
Motorcyclists accounted for 14% of all traffic fatalities in 2021. The vast majority of motorcycle fatalities — 95% — were operators, and 5% were passengers.
An estimated 82,686 motorcycle riders were injured in 2021, a 5% increase from the 78,944 motorcyclists injured in 2020.
Here are some statistics about fatal crashes involving motorcycles in 2021:
- 36% of motorcycle riders involved in fatal crashes did not have valid motorcycle licenses.
- Motorcyclists were more likely to be alcohol-impaired than operators of other types of vehicles (28% of motorcyclists versus 24% of passenger car drivers and 3% of large truck operators).
- One-third of motorcycle riders who died in single-vehicle crashes were alcohol-impaired
- Motorcycle riders killed in traffic crashes at night were three times more likely to be alcohol-impaired than those killed during the day.
- 55% of motorcyclists killed in crashes in states without helmet laws were not wearing helmets.
Motorcyclist Fatality Rates 2012–2021
| Year | Killed | Registered Vehicles | Fatality Rate per 100,000 Registered Vehicles |
|---|---|---|---|
| 2012 | 4,986 | 8,454,939 | 58.97 |
| 2013 | 4,692 | 8,404,687 | 55.83 |
| 2014 | 4,594 | 8,417,718 | 54.58 |
| 2015 | 5,029 | 8,600,936 | 58.47 |
| 2016 | 5,337 | 8,679,380 | 61.49 |
| 2017 | 5,226 | 8,664,108 | 60.32 |
| 2018 | 5,038 | 8,659,741 | 58.18 |
| 2019 | 5,044 | 8,596,314 | 58.68 |
| 2020 | 5,506 | 8,347,435 | 65.96 |
| 2021 | 5,932 | 9,881,414 | 60.03 |
Motorcyclist Injury Rates 2012–2021
| Year | Injured | Registered Vehicles | Injury Rate per 100,000 Registered Vehicles |
|---|---|---|---|
| 2012 | 93,251 | 8,454,939 | 1,103 |
| 2013 | 88,760 | 8,404,687 | 1,056 |
| 2014 | 91,987 | 8,417,718 | 1,093 |
| 2015 | 88,738 | 8,600,936 | 1,032 |
| 2016 | 104,442 | 8,679,380 | 1,203 |
| 2017 | 88,592 | 8,664,108 | 1,023 |
| 2018 | 81,859 | 8,659,741 | 945 |
| 2019 | 83,814 | 8,596,314 | 975 |
| 2020 | 78,944 | 8,347,435 | 946 |
| 2021 | 82,686 | 9,881,414 | 837 |
Car vs. Motorcycle Accident Rates
Comparing the difference in accident rates between motorcycles and cars can offer valuable insights into road safety trends. When we look into factors such as fatality and injury rates per registered vehicle or per vehicle mile traveled (VMT), we can better understand the unique risks faced by motorcyclists on the road.
The NHTSA reports that motorcycles made up just 3.5% of registered vehicles in the United States in 2021 — but motorcyclists accounted for 14% of all traffic fatalities. The fatality rate per registered vehicle for motorcyclists was nearly five times the fatality rate for passenger car occupants.
Statistics for fatalities per VMT are even more stark. In 2021, the fatality rate per VMT for motorcyclists was almost 24 times the rate for occupants of passenger cars. The motorcyclist injury rate was four times that of passenger car occupants.
| Rate | Motorcycles | Passenger Cars | |||
|---|---|---|---|---|---|
| Fatality Rate | Injury Rate | Fatality Rate | Injury Rate | ||
| 2020 | Per 100,000 Registered Vehicles | 65.96 | 946 | 11.42 | 924 |
| Per 100 Million VMT | 30.68 | 440 | 1.22 | 99 | |
| 2021 | Per 100,000 Registered Vehicles | 60.03 | 837 | 12.53 | 1.027 |
| Per 100 Million VMT | 30.20 | 421 | 1.26 | 103 | |
Age Group and Day-of-the-Week Analysis
From 2020 to 2021, the NHTSA reports a noticeable increase in motorcyclist fatalities across various age brackets. The agency also analyzed the timing of fatal crashes.
Here are some points to remember:
- Fatalities among individuals aged 15 to 20 surged by 35%, rising from 218 to 294.
- The 40-to-44 age group experienced a 23% increase in fatalities, jumping from 432 to 531.
- The average age of motorcycle riders killed in traffic crashes remained steady at 43.
- Roughly half of the motorcyclist fatalities occurred during weekends — a consistent pattern across the two years.
- While weekend fatalities remained more common, there was a notable 11% increase in motorcyclist fatalities during weekdays, with the number rising from 2,736 to 3,039.
| Age Group | 2020 | 2021 | ||||
|---|---|---|---|---|---|---|
| Weekday | Weekend | Total* | Weekday | Weekend | Total* | |
| <15 | 7 | 6 | 13 | 6 | 5 | 11 |
| 15-20 | 119 | 99 | 218 | 179 | 115 | 294 |
| 21-24 | 270 | 219 | 489 | 267 | 204 | 472 |
| 25-29 | 337 | 357 | 695 | 384 | 309 | 693 |
| 30-34 | 330 | 350 | 680 | 363 | 337 | 700 |
| 35-39 | 235 | 251 | 487 | 271 | 296 | 568 |
| 40-44 | 218 | 213 | 432 | 248 | 280 | 531 |
| 45-49 | 223 | 264 | 488 | 264 | 271 | 535 |
| 50-54 | 221 | 281 | 505 | 255 | 296 | 552 |
| 55-59 | 270 | 263 | 534 | 255 | 281 | 537 |
| 60-64 | 202 | 225 | 427 | 219 | 213 | 433 |
| 65+ | 302 | 231 | 533 | 328 | 270 | 598 |
| Total* | 2,736 | 2,762 | 5,506 | 3,039 | 2,885 | 5,932 |
Primary Collision Factors for Motorcycle Accidents
A clear understanding of the primary collision factors that contribute to motorcycle deaths in California can empower officials to implement targeted safety measures. Statistics provide valuable insights into the root causes of motorcycle collisions, informing strategies that allow the state to mitigate risks and enhance road safety for riders.
The California Strategic Highway Safety Plan (SHSP) report provides insights into which types of traffic violations lead to motorcycle accidents, separating the data by region. Speeding was the most common violation in every region, including Los Angeles.
| Statewide | Redding | Sacramento | SF/Bay Area | Fresno | Los Angeles | San Diego |
|---|---|---|---|---|---|---|
| Unsafe Speed | 29% | 27% | 28% | 31% | 24% | 29% |
| Improper Turning | 18% | 26% | 16% | 18% | 23% | 16% |
| Automobile Right-of-Way | 17% | 8% | 15% | 13% | 13% | 21% |
| Operating Under the Influence of Alcohol or Drugs | 10% | 13% | 15% | 11% | 14% | 8% |
| Unsafe Lane Change | 5% | 1% | 3% | 7% | 2% | 7% |
Alcohol Involvement in Fatal Motorcycle Accidents
Alcohol plays a role in many fatal motorcycle crashes in California. The NHTSA provides statistics about the prevalence and impact of alcohol impairment among motorcycle riders. This information can offer insights and enable officials to find ways to prevent intoxicated drivers from harming themselves or other road users:
- In 2021, 29% of motorcyclists killed in crashes had a BAC of at least 0.08, compared to 26% in 2020.
- 7% of motorcycle riders killed in 2021 had measurable BACs below the legal limit (between 0.01 and 0.07).
- Motorcycle riders were more likely to be impaired than other road users involved in fatal crashes.
- Riders between 35 and 44 had the highest number of alcohol-impaired motorcycle rider fatalities in 2021.
- 43% of motorcycle riders killed in single-vehicle crashes in 2021 were alcohol-impaired.
- Alcohol impairment was higher in nighttime motorcycle fatalities (42%) compared to daytime (16%).
- In 2021, 52% of people killed in alcohol-related motorcycle accidents were wearing helmets, compared to 66% of sober riders.
| Crash Type and Day of Week | 2020 | 2021 | |||||
|---|---|---|---|---|---|---|---|
| Total Motorcycle Riders Killed | Alcohol-Impaired | Total Motorcycle Riders Killed | Alcohol-Impaired | ||||
| Number | Percent | Number | Percent | ||||
| Single- Vehicle |
Weekday | 945 | 304 (32%) | 968 | 377 (39%) | ||
| Weekend | 1,175 | 506 (43%) | 1,197 | 552 (46%) | |||
| Total* | 2,124 | 812 (38%) | 2,170 | 931 (43%) | |||
| Multiple-Vehicle | Weekday | 1,668 | 225 (13%) | 1,953 | 325 (17%) | ||
| Weekend | 1,405 | 325 (23%) | 1,511 | 368 (24%) | |||
| Total* | 3,075 | 550 (18%) | 3,466 | 693 (20%) | |||
| Total | Weekday | 2,613 | 528 (20%) | 2,921 | 701 (24%) | ||
| Weekend | 2,580 | 831 (32%) | 2,708 | 920 (34%) | |||
| Total* | 5,199 | 1,362 (26%) | 5,636 | 1,624 (29%) | |||
Speeding and Fatal Motorcycle Accidents
The NHTSA also gathers data about motorcycle crashes involving speeding, including when riders were exceeding the speed limit, racing, or driving too fast for current conditions. These are some highlights from the data:
- In 2021, 33% of motorcycle riders in fatal crashes were speeding — significantly higher than the percentage of passenger car, light truck, and large truck drivers.
- Motorcycle riders aged 21 to 24 were more likely to be involved in speeding-related fatal crashes.
| Speeding Involvement | Total | |||||
|---|---|---|---|---|---|---|
| Speeding | Not Speeding | |||||
| Age Group | Number | Percent | Number | Percent | Number | Percent |
| <15 | 1 | 20% | 4 | 80% | 5 | 100% |
| 15-20 | 127 | 43% | 165 | 57% | 292 | 100% |
| 21-24 | 240 | 49% | 248 | 51% | 488 | 100% |
| 25-29 | 333 | 46% | 388 | 54% | 721 | 100% |
| 30-34 | 317 | 44% | 406 | 56% | 723 | 100% |
| 35-39 | 226 | 38% | 366 | 62% | 592 | 100% |
| 40-44 | 173 | 32% | 361 | 68% | 534 | 100% |
| 45-49 | 174 | 32% | 377 | 68% | 551 | 100% |
| 50-54 | 160 | 28% | 421 | 72% | 581 | 100% |
| 55-59 | 122 | 22% | 423 | 78% | 545 | 100% |
| 60-64 | 75 | 17% | 367 | 83% | 442 | 100% |
| 65+ | 77 | 13% | 515 | 87% | 592 | 100% |
| Total* | 2,026 | 33% | 4,054 | 67% | 6,080 | 100% |
Helmet Use and Effectiveness in Fatal Motorcycle Accidents
Helmets are effective at reducing fatalities in motorcycle accidents. That’s why many states, including California, have set safety standards regarding helmet use.
Here are some facts from the NHTSA:
- Helmets saved the lives of 1,872 motorcyclists in 2017; an additional 749 lives could have been saved with universal helmet use.
- Helmets are 37% effective in preventing rider fatalities and 41% effective in preventing fatalities in passengers.
- All U.S. motorcycle helmets must meet FMVSS 218 standards.
- 18 states, including California, have mandated helmet use for all motorcyclists as of 2021, with varying rates of compliance.
- 29 states required helmets for specific subsets of riders, such as minors, while 3 states had no helmet laws.
- In 2021, DOT-compliant helmet use was 64.9% nationwide, but it was significantly higher in states with universal helmet laws.
- States with such laws had usage rates of 86.1%, compared to 53.4% in other states.
- States without universal helmet laws had a higher proportion of unhelmeted fatalities (55% vs. 9%).
Recoverable Damages After a Motorcycle Accident
Victims of motorcycle accidents caused by negligent drivers can seek compensation for their losses, both monetary and nonmonetary.
Awards for such damages might include the following categories:
- Medical Expenses: Hospital bills, surgeries, medications, and rehabilitation treatments.
- Lost Income: Compensation for wages lost due to the inability to work during recovery, including future earning capacity if the injury is permanent.
- Pain and Suffering: Physical pain, emotional distress, and mental anguish endured as a result of the accident and injuries sustained.
- Property Damage: Reimbursement for repair or replacement of the motorcycle, riding gear, and other personal belongings damaged in the accident.
- Wrongful Death: Compensation for surviving family members in the event of a fatal motorcycle accident, including funeral expenses and loss of financial support.
No amount of money can make up for a life-changing injury. However, a successful personal injury claim can empower you to protect your loved ones’ futures and rebuild your life.
Contact an Experienced Motorcycle Accident Lawyer Today
California motorcycle accident statistics serve as a sobering reminder of the importance of prioritizing safety on our roads. While the allure of riding a motorcycle along California’s scenic highways is undeniable, it comes with inherent risks that all riders must acknowledge and address.
If you or a loved one has been involved in a motorcycle accident, the experienced lawyers at Cohen & Marzban are always ready to help. Contact us today for a free consultation and let us advocate for the justice and compensation you deserve. Together, we can work toward safer roads and a brighter future for all motorcycle riders in California.